Case study · 03 / 04

Scan to
Insure.

Cut time-to-quote from 8 minutes to under 5. For a flow that was losing nearly half its users before they ever saw a price.

Mobile-First Sole Designer CURE Auto Insurance
Role
Sole UX/UI Designer
Company
CURE Auto Insurance
Timeline
5-Week Design Sprint
Platform
Mobile-First
Tools
Figma · Lottie · High-Fi Prototyping · Usability Testing
— 01 / Overview

A new experience built around the fastest path to a quote.

CURE Auto Insurance is a direct-to-consumer auto insurance provider serving drivers in New Jersey and Pennsylvania. I was brought in to redesign their existing quote flow — the primary entry point for new customers seeking an insurance quote.

As part of that redesign, a recurring theme emerged: the biggest source of friction wasn't the flow structure alone — it was manual data entry. Users were expected to recall and type information directly from their driver's license across more than 20 screens. That insight drove a parallel workstream: designing a Driver's License Scan feature — an API-powered capability that automatically extracts a user's personal information, registered vehicles, and household members directly from their scanned license, eliminating manual input and dramatically reducing the steps required to reach a quote.

— 02 / The Problem

What the data showed — nearly half of users were leaving before seeing a price.

Before I joined the project, CURE's Customer Experience team had been monitoring the Quick Quote funnel through internal session analytics and inbound support data. What they found was consistent and costly: users were abandoning the flow at high rates, and those who did call support most often cited confusion and frustration during the information entry phase.

Their data established the following baseline across a 90-day sample period:

Metric Baseline (90-Day Sample)
Quote funnel completion rate 52%
Average time-to-quote 8 min 41 sec
Drop-off at personal info entry screens 41%
Drop-off at vehicle entry screens 28%
Support contacts initiated mid-flow 14% of sessions

The support log analysis surfaced two recurring themes: users who didn't know what information was being asked of them, and users who had made an error mid-flow but couldn't correct it without restarting from the beginning. Nearly half of all users were walking away before ever seeing a quote.

The directive was clear: reduce friction, reduce screens, and give the scan feature the experience it deserved.

Six screens, each doing one job. Scan your license, confirm your info, get your quote.
How might we

…make scanning a driver's license feel like the natural, obvious way to start a quote?

— 03 / Discovery

Auditing 20 screens to understand exactly where the flow was failing.

Before designing anything, I needed to understand exactly why the flow was failing — not just that it was. I walked the existing 20-screen experience against two lenses: a formal heuristic evaluation and a task-level field count.

Heuristic Evaluation

I evaluated the existing flow against Nielsen's 10 Usability Heuristics and documented violations at each step. The three most critical failures:

  • Recognition over recall — Users were expected to locate and type information from a physical document (license number, VIN) rather than having the system recognize it for them. There was no scan capability — users had no choice but to enter everything manually.
  • User control and freedom — There was no clear path to correct a mistake without losing all progress and restarting the flow from the beginning.
  • Aesthetic and minimalist design — Multiple screens contained redundant fields and information that had no bearing on the current step, adding cognitive load without adding value.
Task Analysis

I mapped every user action required across all 20 screens and counted each manual input field. The result: 24 total input fields, of which 16 were directly obtainable via the Driver's License Scan API — including name, date of birth, address, license number and status, registered vehicles, and household members.

That analysis made the case for the scan feature being the structural solution, not a surface-level enhancement. The majority of the form didn't need to be filled out by users at all — the API could do it for them.

— 04 / Goals

Three measurable outcomes before any design work began.

Based on the CX team's baseline data and my flow audit, I aligned with stakeholders on three concrete goals before touching a single frame in Figma. This kept the work anchored to outcomes, not aesthetics.

  1. 01

    Increase quote funnel completion rate by reducing the number of steps and eliminating manual entry wherever the scan API could substitute.

  2. 02

    Reduce average time-to-quote by making the scan the default path through the flow.

  3. 03

    Reduce drop-off at personal info and vehicle entry specifically — the two highest abandonment points in the existing flow.

— 05 / Constraints & Challenges

Modernize without alienating.

This project had a clear creative tension at its center.

CURE's leadership was supportive of improvement but protective of their brand's visual language. Early prototypes pushed the design too far in a contemporary direction — cleaner layouts, bolder typography, more whitespace — and stakeholder feedback brought me back to center. They wanted the product to feel improved, not unrecognizable.

That constraint became a useful guardrail. Rather than chasing visual novelty, I focused on structural improvements: how information was grouped, how many decisions a user had to make per screen, and how clearly the interface communicated progress and next steps. The visual surface stayed familiar. The underlying experience got a complete overhaul.

The scan feature itself was powered by a third-party API — meaning my design contribution focused entirely on the surrounding experience: how we primed users to trust and use the feature, what the confirmation states looked like, and how we handled edge cases where the API data needed correction.

The best UX work often happens within constraints, not in spite of them. — Reflection on the Scan to Insure project
— 06 / Design Decisions

Two decisions that changed what the flow asks of users.

The redesign wasn't about new components or a new visual style. It was about reducing the number of things users had to do — and making every remaining step feel obvious.

Screen 1 — Start & Scan
01 · Start & Scan
Screen 2 — Confirm Info
02 · Confirm Info
Screen 3 — Driver Confirmation
03 · Driver Confirmation
Screen 4 — Vehicle Confirmation
04 · Vehicle Confirmation
Screen 5 — Coverage
05 · Coverage
Screen 6 — Quote Summary
06 · Quote Summary
Decision 01

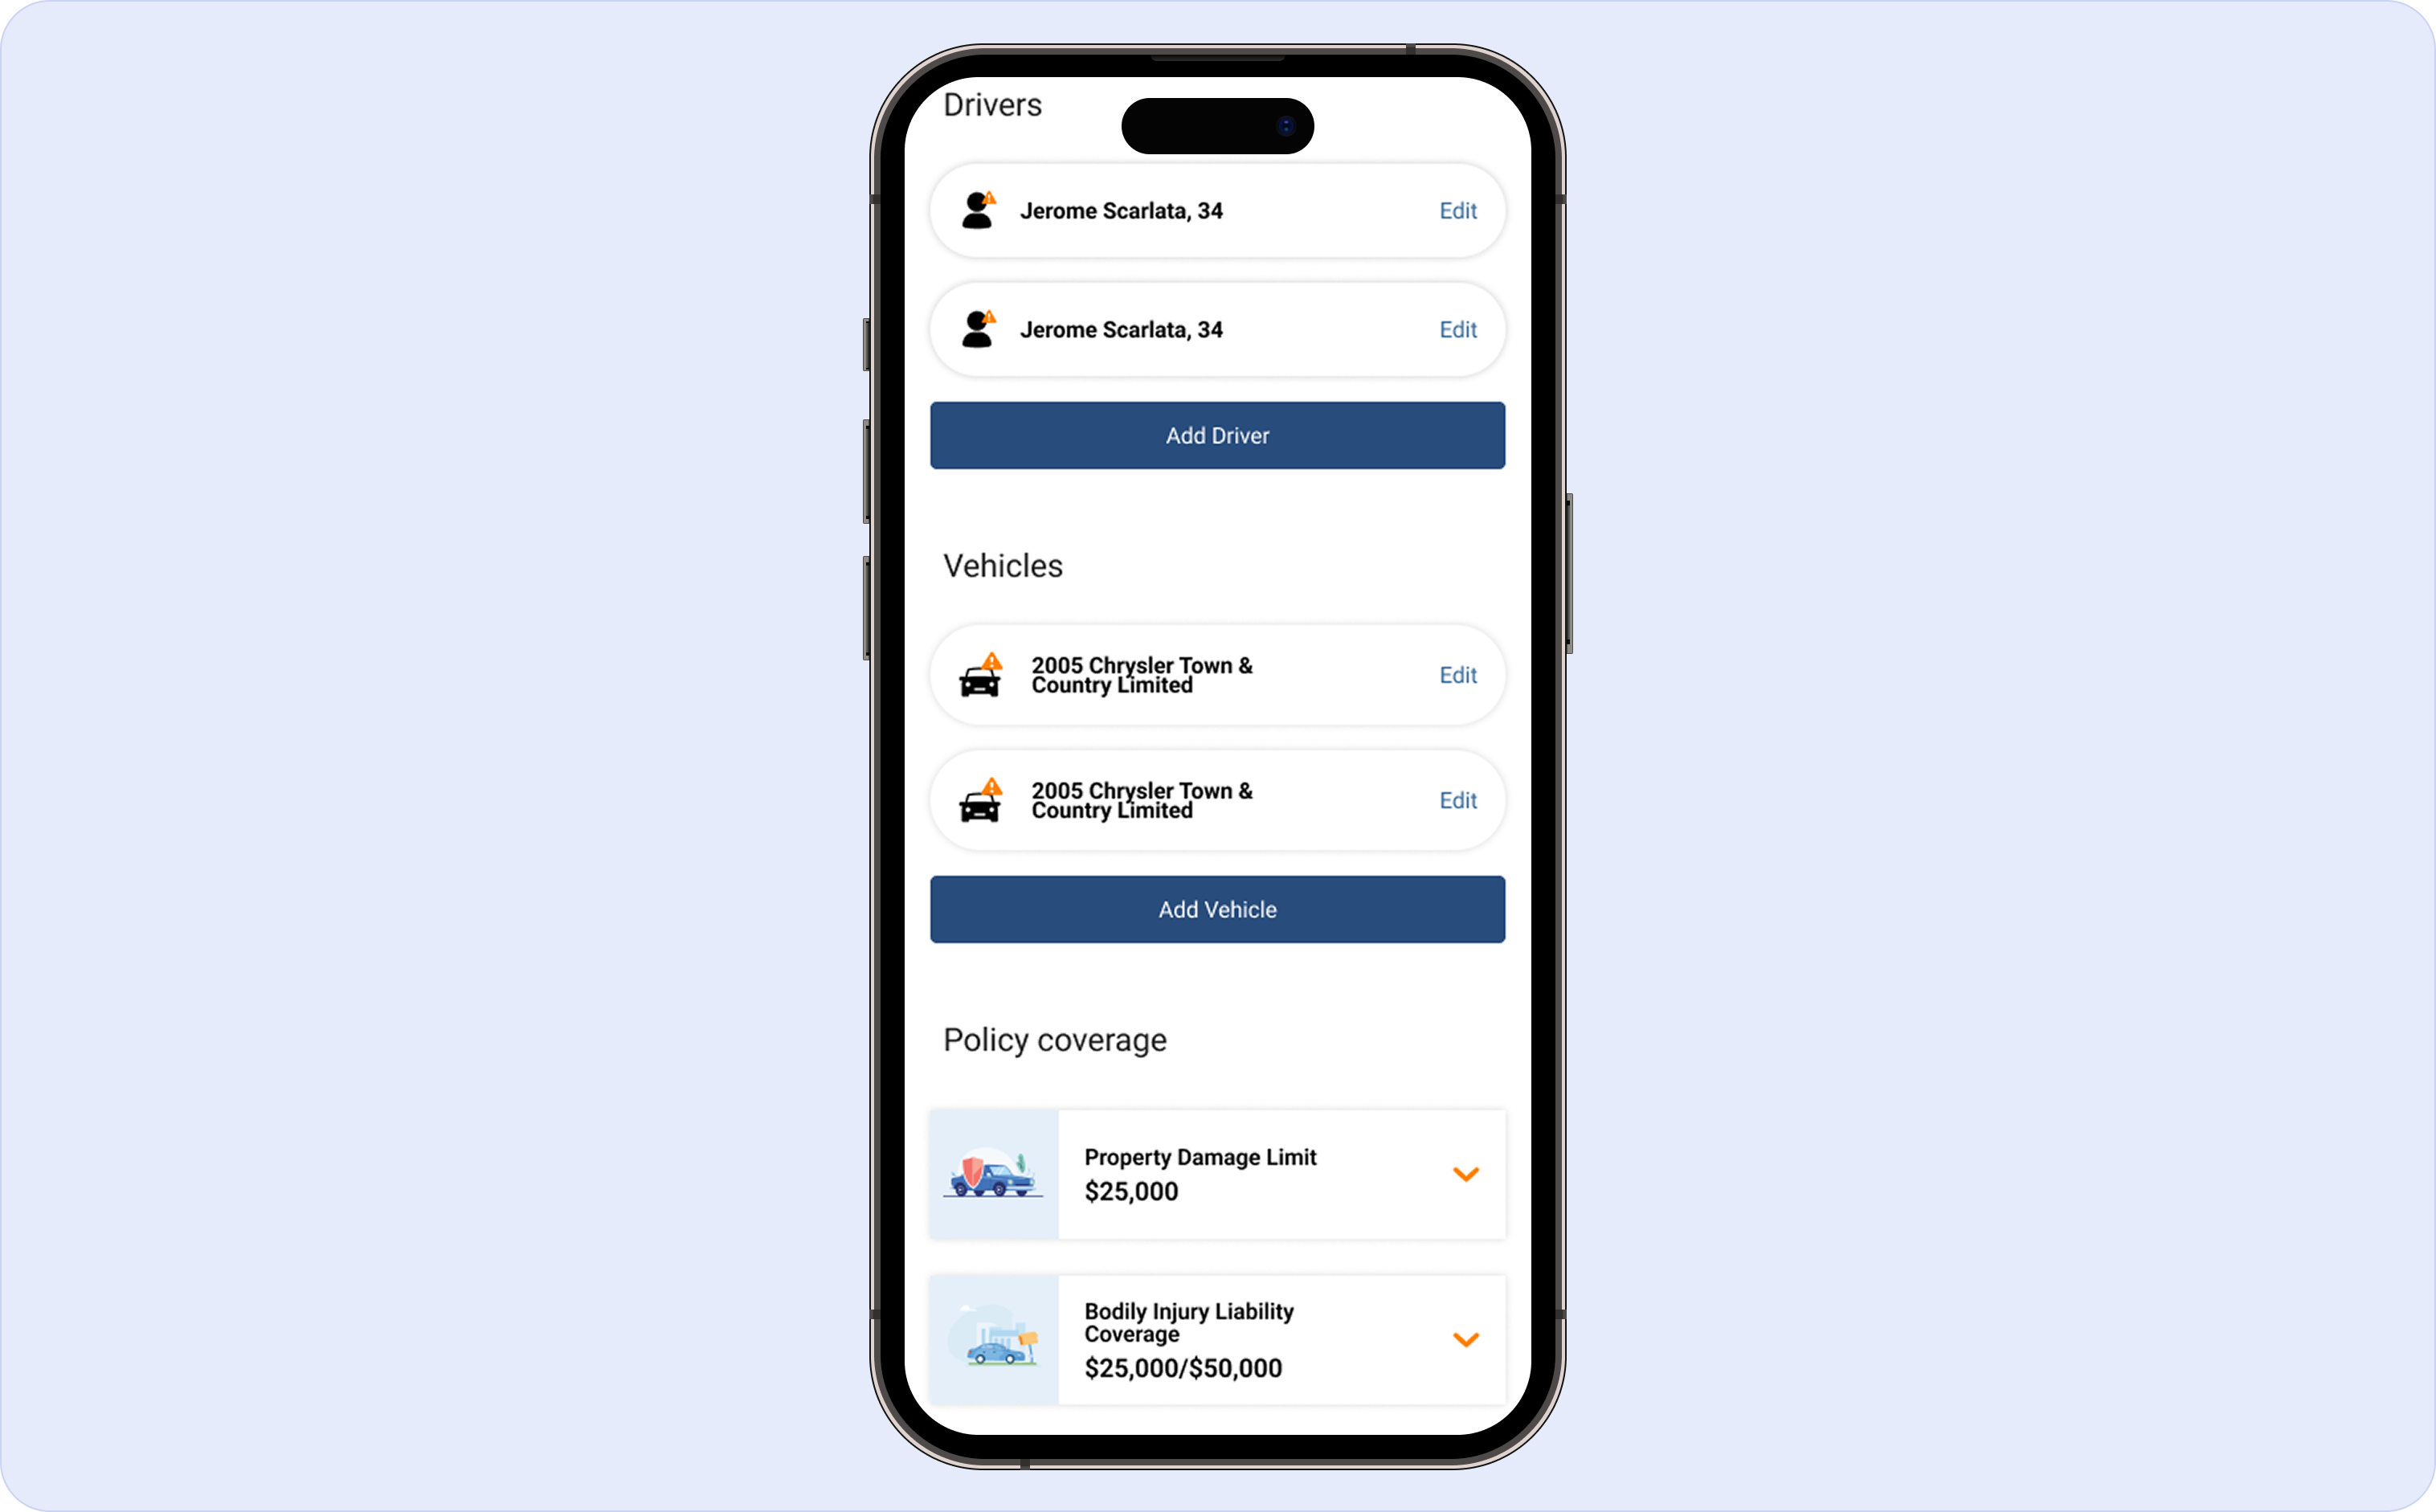
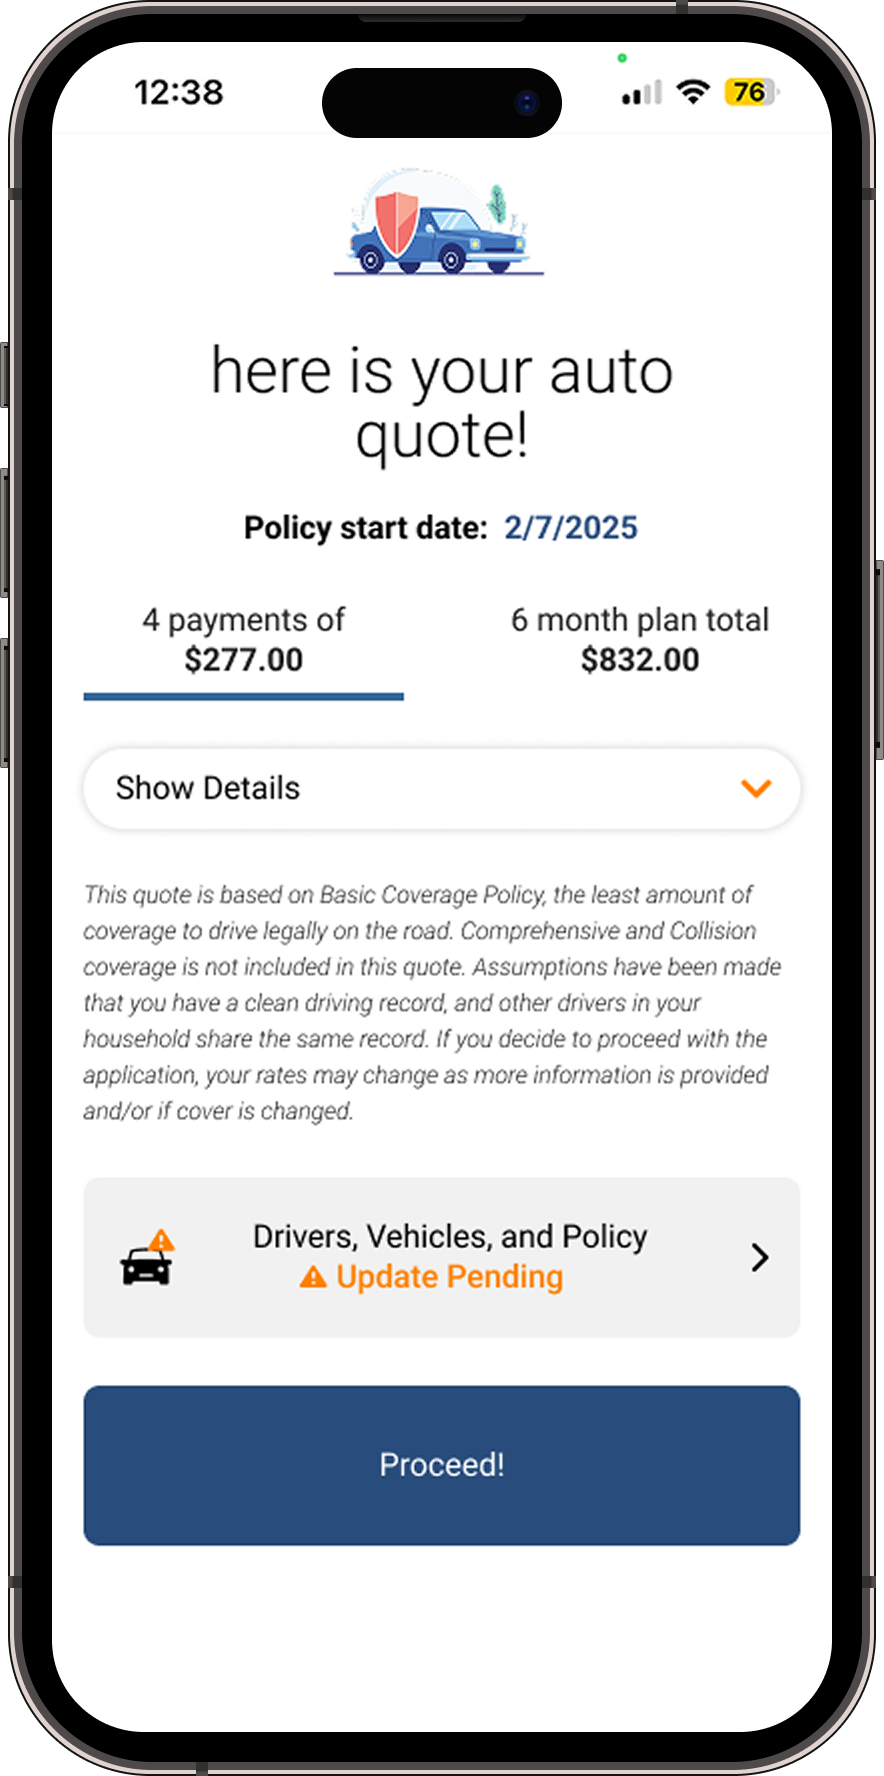
One screen for drivers, vehicles, and coverage.

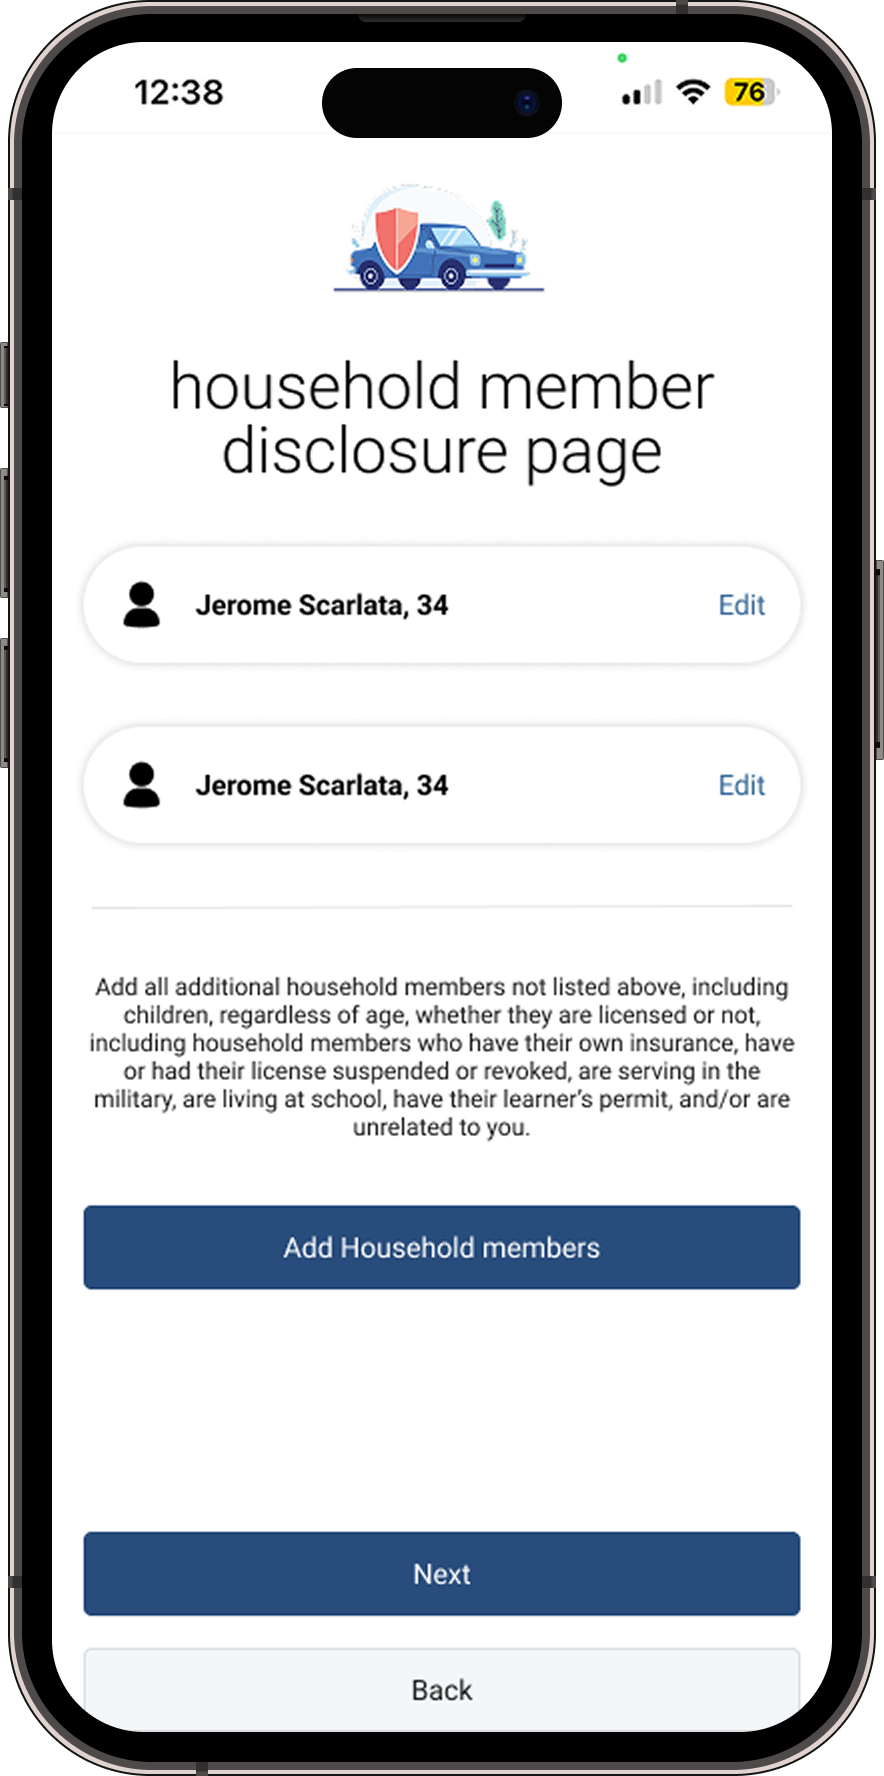
In the original flow, drivers, vehicles, and policy coverage lived in three separate sections. Users had to navigate between them to build a complete picture of their quote — losing context with every transition and often unsure whether a change in one section affected another.

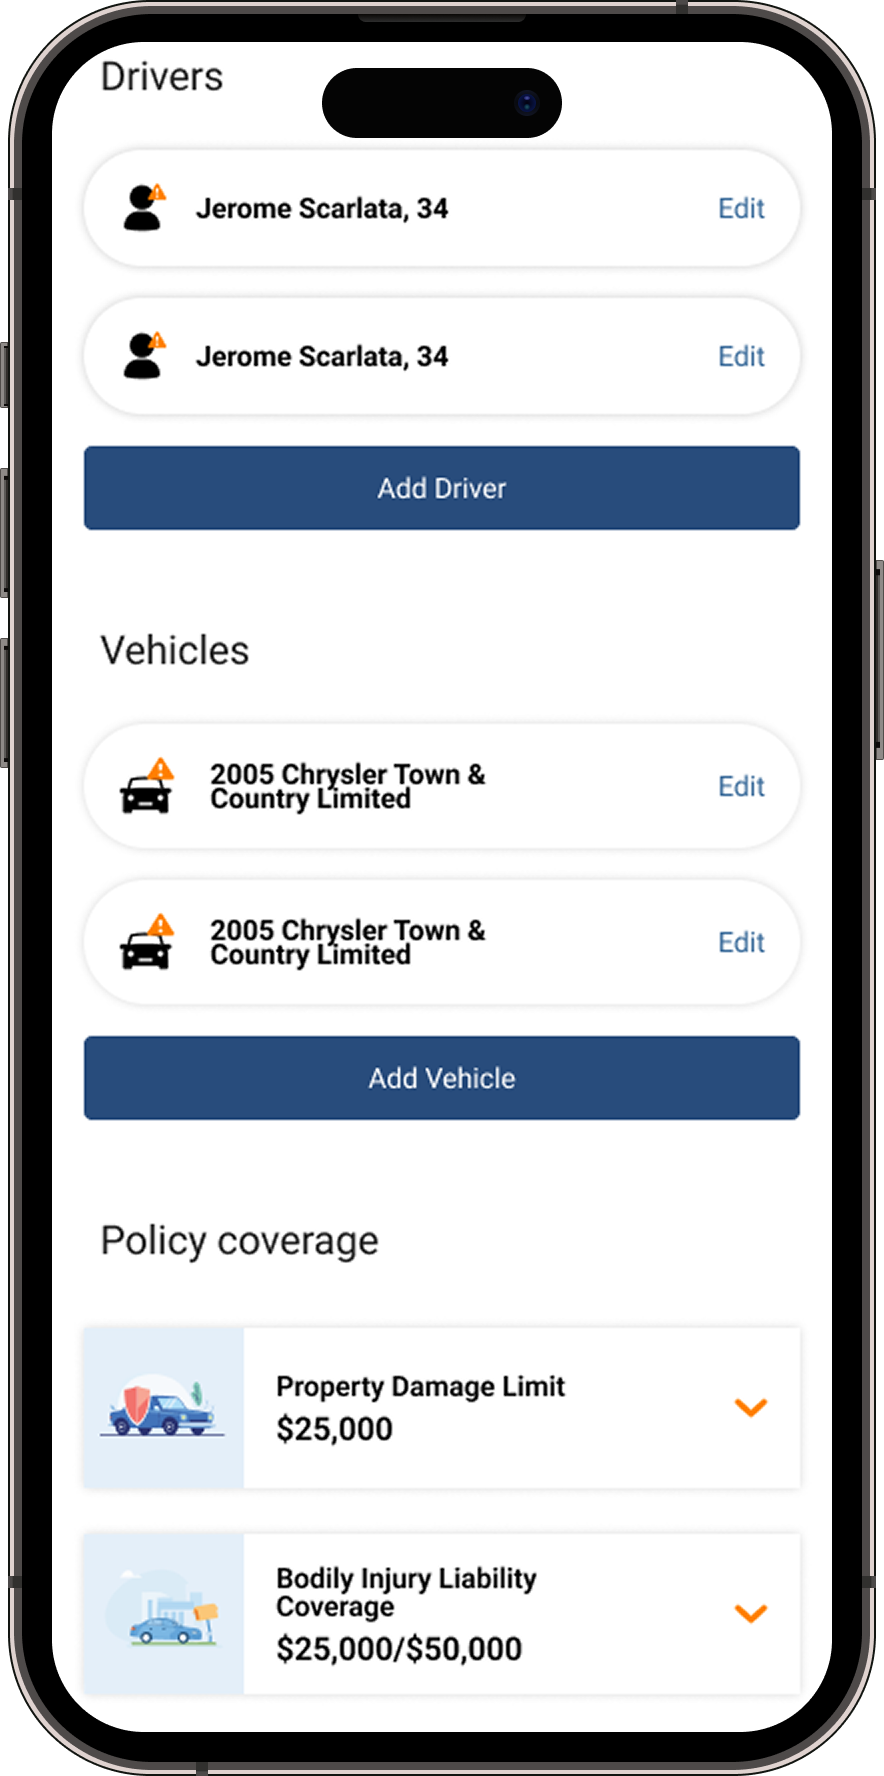
The redesign consolidated all three onto a single screen. Users get full visibility at once: who's on the policy, what vehicles are covered, and what coverage is selected — all in one view. No round-trips, no mental juggling between sections. The cognitive load of "managing a quote" collapses into a single review.

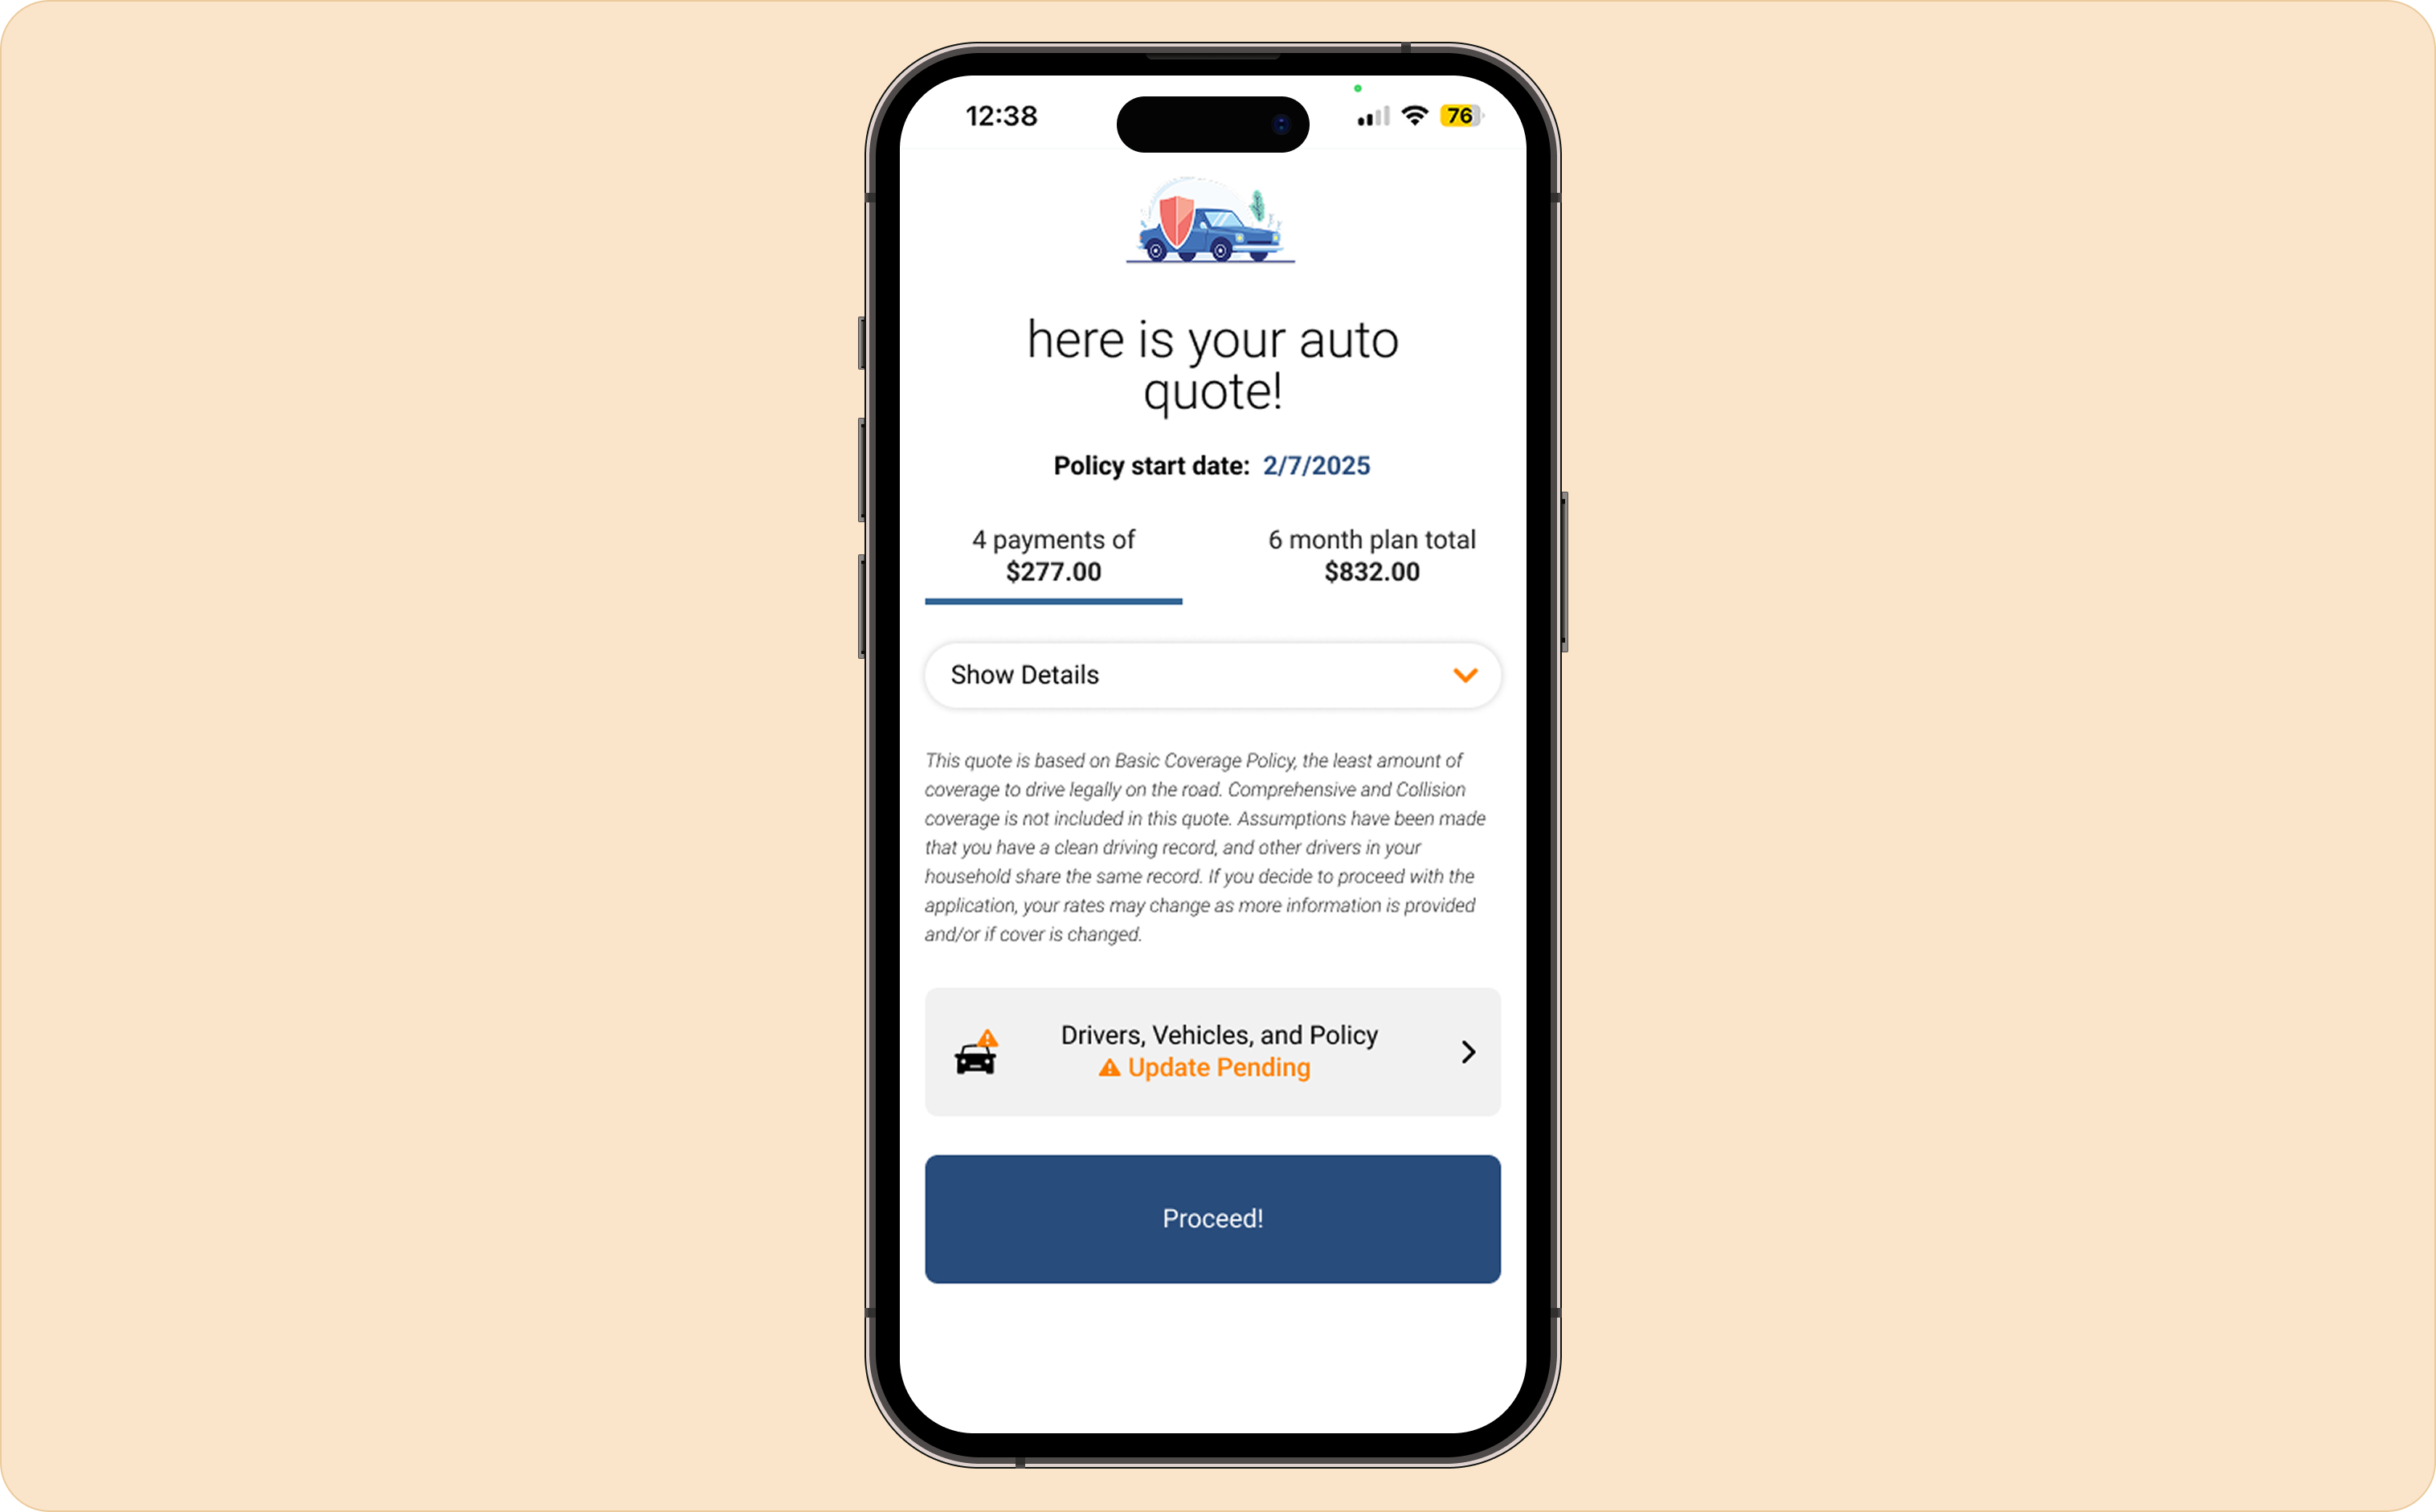
The pre-populated cards — pulled from the scan API — meant users were confirming rather than entering. That shift in interaction model, combined with the consolidated layout, made the heaviest part of the old flow feel almost effortless.

Consolidated screen showing Drivers, Vehicles, and Policy Coverage in one view
Drivers, vehicles, and policy coverage — previously three separate navigational destinations — unified into one screen.
Decision 02

A quote page worth arriving at.

The old quote summary was a wall of undifferentiated text — dense, flat, and hard to parse. There was no clear focal point. Users couldn't tell at a glance what their quote actually was.

The redesigned summary page treats pricing as the hero. It's surfaced prominently at the top, before anything else. Coverage details are organized into scannable sections. A readable disclaimer explains exactly what the baseline quote includes:

"This quote is based on Basic Coverage Policy, the least amount of coverage to drive legally on the road. Comprehensive and Collision coverage is not included in this quote. Assumptions have been made that you have a clean driving record, and other drivers in your household share the same record. If you decide to proceed with the application, your rates may change as more information is provided and/or if coverage is changed."

Users who wanted more comprehensive coverage could edit their policy directly from this screen. The quote became a starting point for a conversation, not a final verdict.

Redesigned quote summary — pricing surfaced as the hero with payment breakdown and editable coverage
The quote as a starting point, not a verdict — pricing surfaced at the top, coverage editable from the same screen.
— 07 / Research & Validation

A three-phase approach to validating the redesign before handoff.

The research on this project ran in two directions simultaneously: building the quantitative case for the redesign using existing data, and validating the design decisions through moderated usability testing before development began.

Phase 1

Baseline: CX Analytics Review

The CX team's 90-day flow data established the problem quantitatively before I joined. Their support log analysis added the qualitative layer — surfacing the specific friction points that were driving both abandonment and inbound contacts. This gave me a defined problem to design against, not a vague mandate to "make it better."

Phase 2

Expert Review: Comparative Heuristic Evaluation

Before running any user sessions, I conducted a formal heuristic evaluation of both the existing flow and the redesigned prototype, scoring each against Nielsen's 10 Usability Heuristics. This provided a documented, expert-level rationale for each structural change — separating design decisions from design preferences.

Phase 3

Validation: Moderated Usability Testing

Following the design sprint, I conducted moderated task-based usability testing on the high-fidelity Figma prototype to validate the redesign before handoff to development.

  • Participants: 6 adults aged 25–55 who had shopped for auto insurance within the past 12 months, recruited to reflect CURE's primary user demographic.
  • Protocol: Each session ran 25–30 minutes via video call with screen sharing. Participants received a single scenario-based task with no instructional framing: "Imagine you're looking to get a new car insurance quote. Go ahead and get started."
  • Think-aloud: Participants verbalized their reasoning in real time as they moved through the prototype. Sessions were recorded with consent. A secondary note-taker logged observations independently from the facilitator to reduce bias in synthesis.
  • Metrics captured: Task completion rate (binary: did the participant reach the quote screen?), time-on-task, critical errors, and hesitation points — pauses exceeding 3 seconds without action, logged by screen.
— 08 / Results

The redesigned flow performed measurably better across every tracked metric.

Task Completion
52%
from 52%
Time to Quote
8:41
from 8:41
Personal Info Drop-Off
41%
from 41%
Vehicle Drop-Off
28%
from 28%
Metric CX Baseline (Live Flow) Usability Testing (Prototype)
Task completion rate 52% 67%
Average time-to-quote 8 min 41 sec 4 min 55 sec
Drop-off at personal info entry 41% Eliminated — screen no longer exists
Drop-off at vehicle confirmation 28% 9%
Support contacts initiated mid-flow 14% of sessions N/A — prototype context
Key Observations from Sessions
  • 01All 6 participants successfully completed the scan step without facilitation or prompting.
  • 02Hesitation was most frequently observed at the vehicle confirmation screen — 3 of 6 participants paused to read the pre-populated vehicle details carefully before confirming. That's the confirmation pattern working as intended: users were reviewing, not skipping.
  • 032 participants verbally expressed surprise at how quickly they reached the quote screen.
  • 040 participants attempted to abandon the task or expressed a desire to contact support during the session.

The 9% residual drop-off at vehicle confirmation reflects a real edge case: some users will see a vehicle or household member listed that doesn't match their current situation — a car they no longer own, a family member they don't want on the policy — and will exit to sort it out rather than proceed. That's not a design failure. That's the system surfacing accurate data that requires a real-world decision.

— 09 / Reflection

Paused in development — and already pointing to the next question.

This project is currently paused in development following stakeholder approval. The design sprint reinforced how much structural UX work can be accomplished in a tight timeline when the problem is clearly defined upfront — and when the data to define it already exists.

Working within the constraint of CURE's visual language didn't limit the design. It forced me to find improvements that were structural and behavioral, not just aesthetic. The end result was something that genuinely served users better without requiring them to learn a new product.

If I were to continue iterating, the next design problem worth solving is one the usability sessions hinted at: trust in pre-populated data. Users paused at the vehicle confirmation screen not because the design was confusing, but because they were reading carefully before agreeing. That's healthy behavior — but it also raises a question worth testing: how might we design the confirmation experience to make users feel more confident that what they're seeing is accurate and up to date? Answering that question with a second round of testing would be the natural next step.

Next case study

Redesigning the portal that keeps policyholders.